This assignment was to use various geoprocessing tools for vector analysis in ArcGIS to determine suitable habitat for bears in the study area of Marquette County, Michigan. We started by mapping a GPS MS Excel file of black bear locations in Michigan. Then we needed to determine the forest types where black bears are found in central Marquette County, Michigan based on GPS locations of black bears. After that is was important to know if bears are found near streams. Our next goal was to find suitable bear habitat based on two criteria. Finding all areas of suitable bear habitat within areas managed by the Michigan DNR was next. Then we needed to eliminate areas near urban or built up lands. And finally generate a cartographic output.
The first thing I had to do was get the X, Y coordinate data from the Excel sheet to ArcMap in a form it could understand, this was done through Add Data - Add X, Y Data. Then I added the feature, which were the bear points, and fixed the symbology. I then performed a special join between the bear locations feature class and the landcover feature class. By summarizing the minor type through the attribute table I was able to find the three most popular landcover types for the bears. Forested Wetlands, Mixed Forest Land, and Evergreen Forest Land.
Finding out if bears liked to be by streams was the next task on my list. To do this I performed a buffer on the streams of 500 meters. This showed that bears do prefer to be near streams as 72% of the points were found within 500 meters of a stream.
To find where the 3 most popular land types overlapped within the stream buffer I created a new layer that just held the popular land types. After that I used the intersect tool to find out where they overlapped.
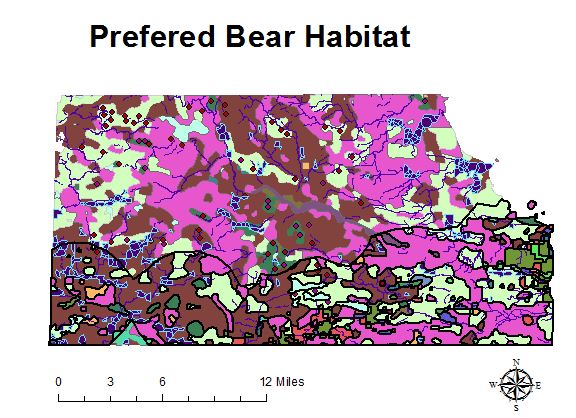
The next part of the assignment was to find where the overlap from the last part overlapped with where the DNR was able to manage. After adding the dnr-mgmt layer, I needed to clean up the map because that layer was bigger than the study area. To clean it up I used the clip tool so only the management areas inside the study area stayed. Then I intersected the newly clipped layer with the preferred habitat layer. This is shown in the map as the purple areas with a blue outline.
Getting the urban areas out of the way was the next task on the list. After adding in the layer the showed where the urban areas were I used the buffer tool to create a 5 kilometer buffer around the urban areas. This produced a big mess of circles, so to clean it up I used the union tool to try make it look nicer. After trying things with that to get the best result I changed the symbology of the layer so that only the outline of the 5 km circle would show. Some of the edges went off the map so I used the clip tool again to keep the results within the study area.
You will see on the map that most of the bottom 1/3 of the map is outlined in thick black. I used this method to show what areas were inside the 5km buffer around the urban areas. So all of the preferred habitat areas outside of the thick black are places the DNR could safely help the bears.
Finding out if bears liked to be by streams was the next task on my list. To do this I performed a buffer on the streams of 500 meters. This showed that bears do prefer to be near streams as 72% of the points were found within 500 meters of a stream.
To find where the 3 most popular land types overlapped within the stream buffer I created a new layer that just held the popular land types. After that I used the intersect tool to find out where they overlapped.
The next part of the assignment was to find where the overlap from the last part overlapped with where the DNR was able to manage. After adding the dnr-mgmt layer, I needed to clean up the map because that layer was bigger than the study area. To clean it up I used the clip tool so only the management areas inside the study area stayed. Then I intersected the newly clipped layer with the preferred habitat layer. This is shown in the map as the purple areas with a blue outline.
Getting the urban areas out of the way was the next task on the list. After adding in the layer the showed where the urban areas were I used the buffer tool to create a 5 kilometer buffer around the urban areas. This produced a big mess of circles, so to clean it up I used the union tool to try make it look nicer. After trying things with that to get the best result I changed the symbology of the layer so that only the outline of the 5 km circle would show. Some of the edges went off the map so I used the clip tool again to keep the results within the study area.
You will see on the map that most of the bottom 1/3 of the map is outlined in thick black. I used this method to show what areas were inside the 5km buffer around the urban areas. So all of the preferred habitat areas outside of the thick black are places the DNR could safely help the bears.
 RSS Feed