This exercise requires the application of skills acquired completing previous exercises towards the completion of a map depicting percentages of Whites (European Americans), Blacks (African Americans), Asian Americans, and Hispanics/Latino(a)s in an American city at the census tract level.
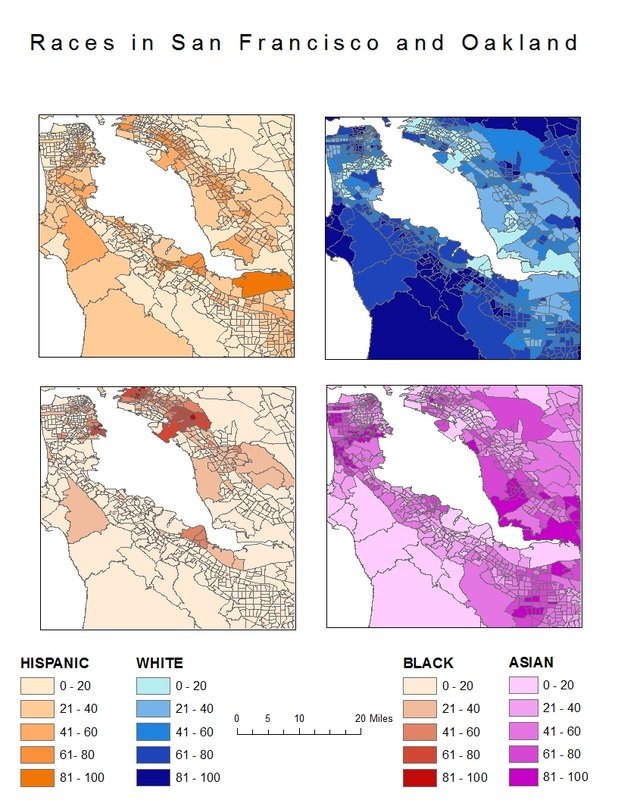
From the allowed cities listed I picked San Francisco. Centering the map was the first thing I did, and it took me a while cause I was picky about what I wanted shown and after that was done the rest was easy. I used ArcGIS to configure the data for each one, then made them all have equal intervals for the classifications to make them easier to read as a set.
 RSS Feed