Goal of the Lab: Gain experiance in the measurement and interpretation of spectral signatures of different surface materials in satellite images. Learn how to collect spectral signatures from remotely sensed images and graph them.
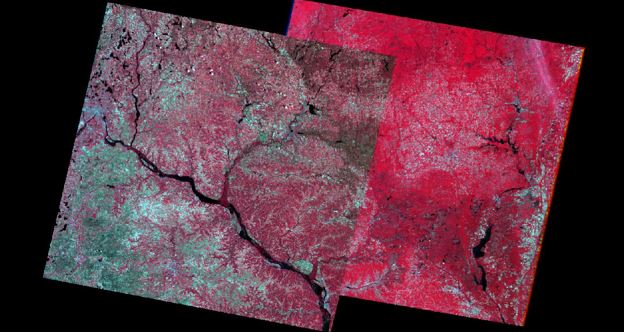
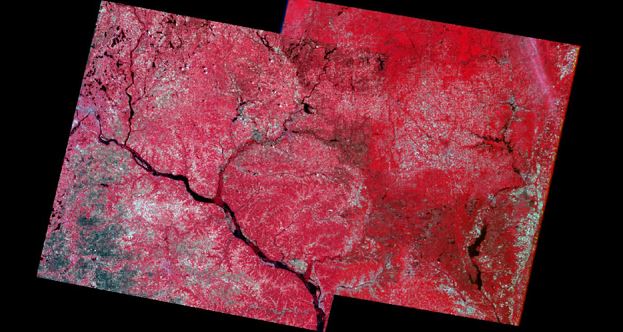
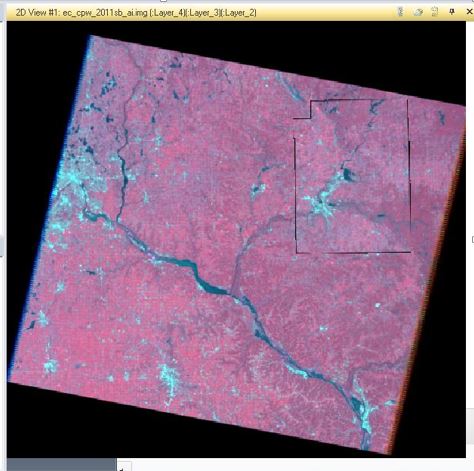
In this lab the data used was from Landsat ETM+, an image covering Eau Claire and surrounding areas. There were 12 materials & surfaces with which we were supposed to plot the spectral reflectance of. These 12 were, Standing Water, Moving Water, Vegetation, Riparian Vegetation, Crops, Urban Grass, Dry Soil(uncultivated), Moist soil (uncultivated), rock, asphalt highway, airport runway and a concrete surface like a parking lot. There is a to collect this data in the field using an instrument call a Spectroradiometer, but we are using the computer for this lab.
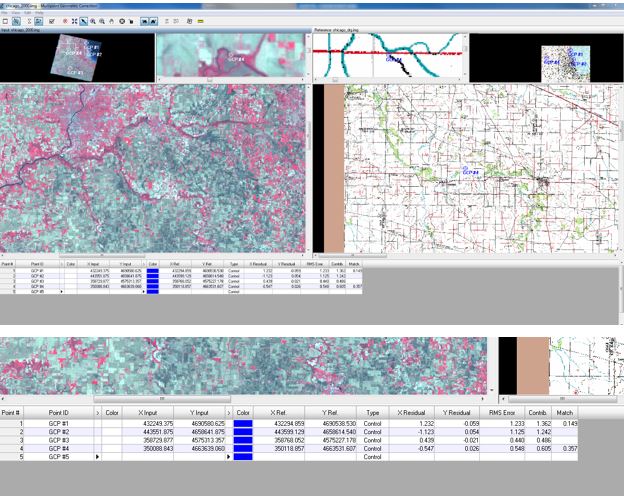
To start, after the image was added to the Erdas viewer, the image was zoomed to a familiar area. This area is Eau Claire and the first collection was from Lake Wissota. Under the Home interface click the Drawing option. Then once under Drawing select the polygon tool, and click to create a polygon on the area with which the data will be collected, double clicking at the end to close the polygon. Once the polygon is closed in the Raster tab in the Supervised option Signature Editor should be clicked.
Now it the new interface click Create New Signture(s) from AOI, this will add the polygon that's just been created under Class 1. For ease of understanding the names were changed to what surface/material is was to understand the graph later. So Class 1 became Standing Water, Class 2 became Moving Water and so on. To put this into the graph click Display Mean Plot Window and the graph display should pop up.
In this lab the data used was from Landsat ETM+, an image covering Eau Claire and surrounding areas. There were 12 materials & surfaces with which we were supposed to plot the spectral reflectance of. These 12 were, Standing Water, Moving Water, Vegetation, Riparian Vegetation, Crops, Urban Grass, Dry Soil(uncultivated), Moist soil (uncultivated), rock, asphalt highway, airport runway and a concrete surface like a parking lot. There is a to collect this data in the field using an instrument call a Spectroradiometer, but we are using the computer for this lab.
To start, after the image was added to the Erdas viewer, the image was zoomed to a familiar area. This area is Eau Claire and the first collection was from Lake Wissota. Under the Home interface click the Drawing option. Then once under Drawing select the polygon tool, and click to create a polygon on the area with which the data will be collected, double clicking at the end to close the polygon. Once the polygon is closed in the Raster tab in the Supervised option Signature Editor should be clicked.
Now it the new interface click Create New Signture(s) from AOI, this will add the polygon that's just been created under Class 1. For ease of understanding the names were changed to what surface/material is was to understand the graph later. So Class 1 became Standing Water, Class 2 became Moving Water and so on. To put this into the graph click Display Mean Plot Window and the graph display should pop up.
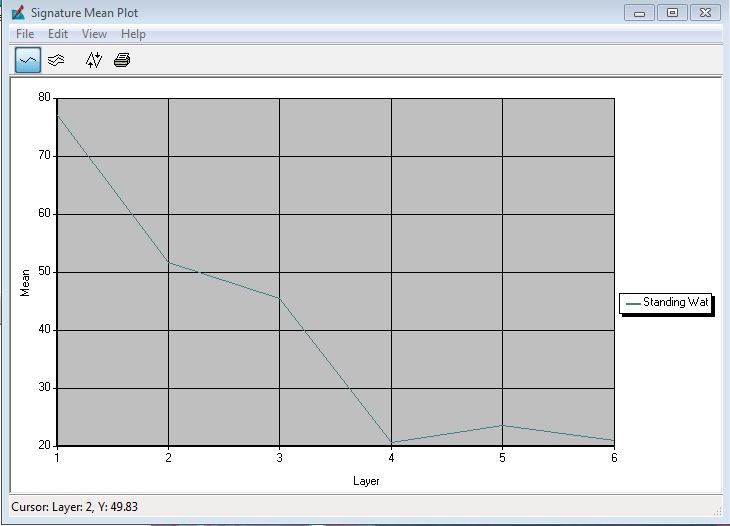
"Specify the spetral channel(bands) in micrometer for the highest and lowest reflectanse for the standing water signature." - The Blue band is highest and the near infrared in the lowest.
"Why did standing water demonstrate the highest and lowest reflectance at the spectral channel(bands) you specificed in Q.1?" - Because water reflects back blue light the most and absorbs the infrared. It should be low across all the infrared but there must be something in the water to reflect back the light.
After this the same process was repeated for the rest of the surface/materials and the graphs made.
"Specify the spectral Channel(band) in micrometer for the highest and lowest reflectance for signatures 2-12." - Sig 2: high-blue, low- all of infrared. Sig 3: high-close to middle infrared, low- red. Sig 4: high-close-middle infrared, low – red. Sig 5: high-tied between blue, red and middle infrared. Low- far infrared. Sig 6: high-close to middle infrared, low- far infrared. Sig 7: high- close to middle infrared, low-far infrared. Sig 8: high- middle infrared, low- red. Sig 9: high-middle infrared, low- red. Sig 10: high-red, low-close-infrared. Sig 11: high-red & middle red, low-close infrared.
"Why did vegitation display the highest and lowest reflectanxe at the spectral channels you specifec in Q3?" - Highest in the close to low infrared because of all the water in it and low in the red because it absorbs all the red.
"At which spectral channel (band) does dry and moist soil vary the most? Explain reasons for the differences." - The biggest differences are in the red and far red bands. The difference is caused by the larger amount of water in the moist soil.
"Describe spectral signatures that are most similar across the spectral channels and those that greatly differ. Make sure you idenfify the surface features you are talking about. In your reponse, outline reasons for similarities and differences of the spectral signatures across the spectral channels." - Similar – vegetation and riparian zone- they are both vegetation so it makes sense that the lines would look the same, the only difference being the riparian zone has more water. Urban grass and riparian zone- again both are vegetation and these two are more similar because usually in urban environments people water their grass. Wet soil and rock- this was probably because where I thought I found rock probably wasn’t. Dry soil and asphalt – I’m assuming these are similar because there is no water in either and asphalt is mostly just dried types of dirt and such. Different – wet and dry soil- huge difference between these due to water differences. The vegetation ones are all very different then the dry soil, asphalt and runway.
"If you are asked to develop a sensor that collects data for indetification of most of the most above surfaces, which specific spectral channels would you use and why?" - Collect in visible and middle infrared. Most of these have high reflectance in these zones.

 RSS Feed